Previous
Drive a rover (2 min)
In this tutorial you will use a fleet of devices to collect air quality data from different places and display the most recent readings from each device in a custom viewing dashboard.
By completing this project, you will learn to:
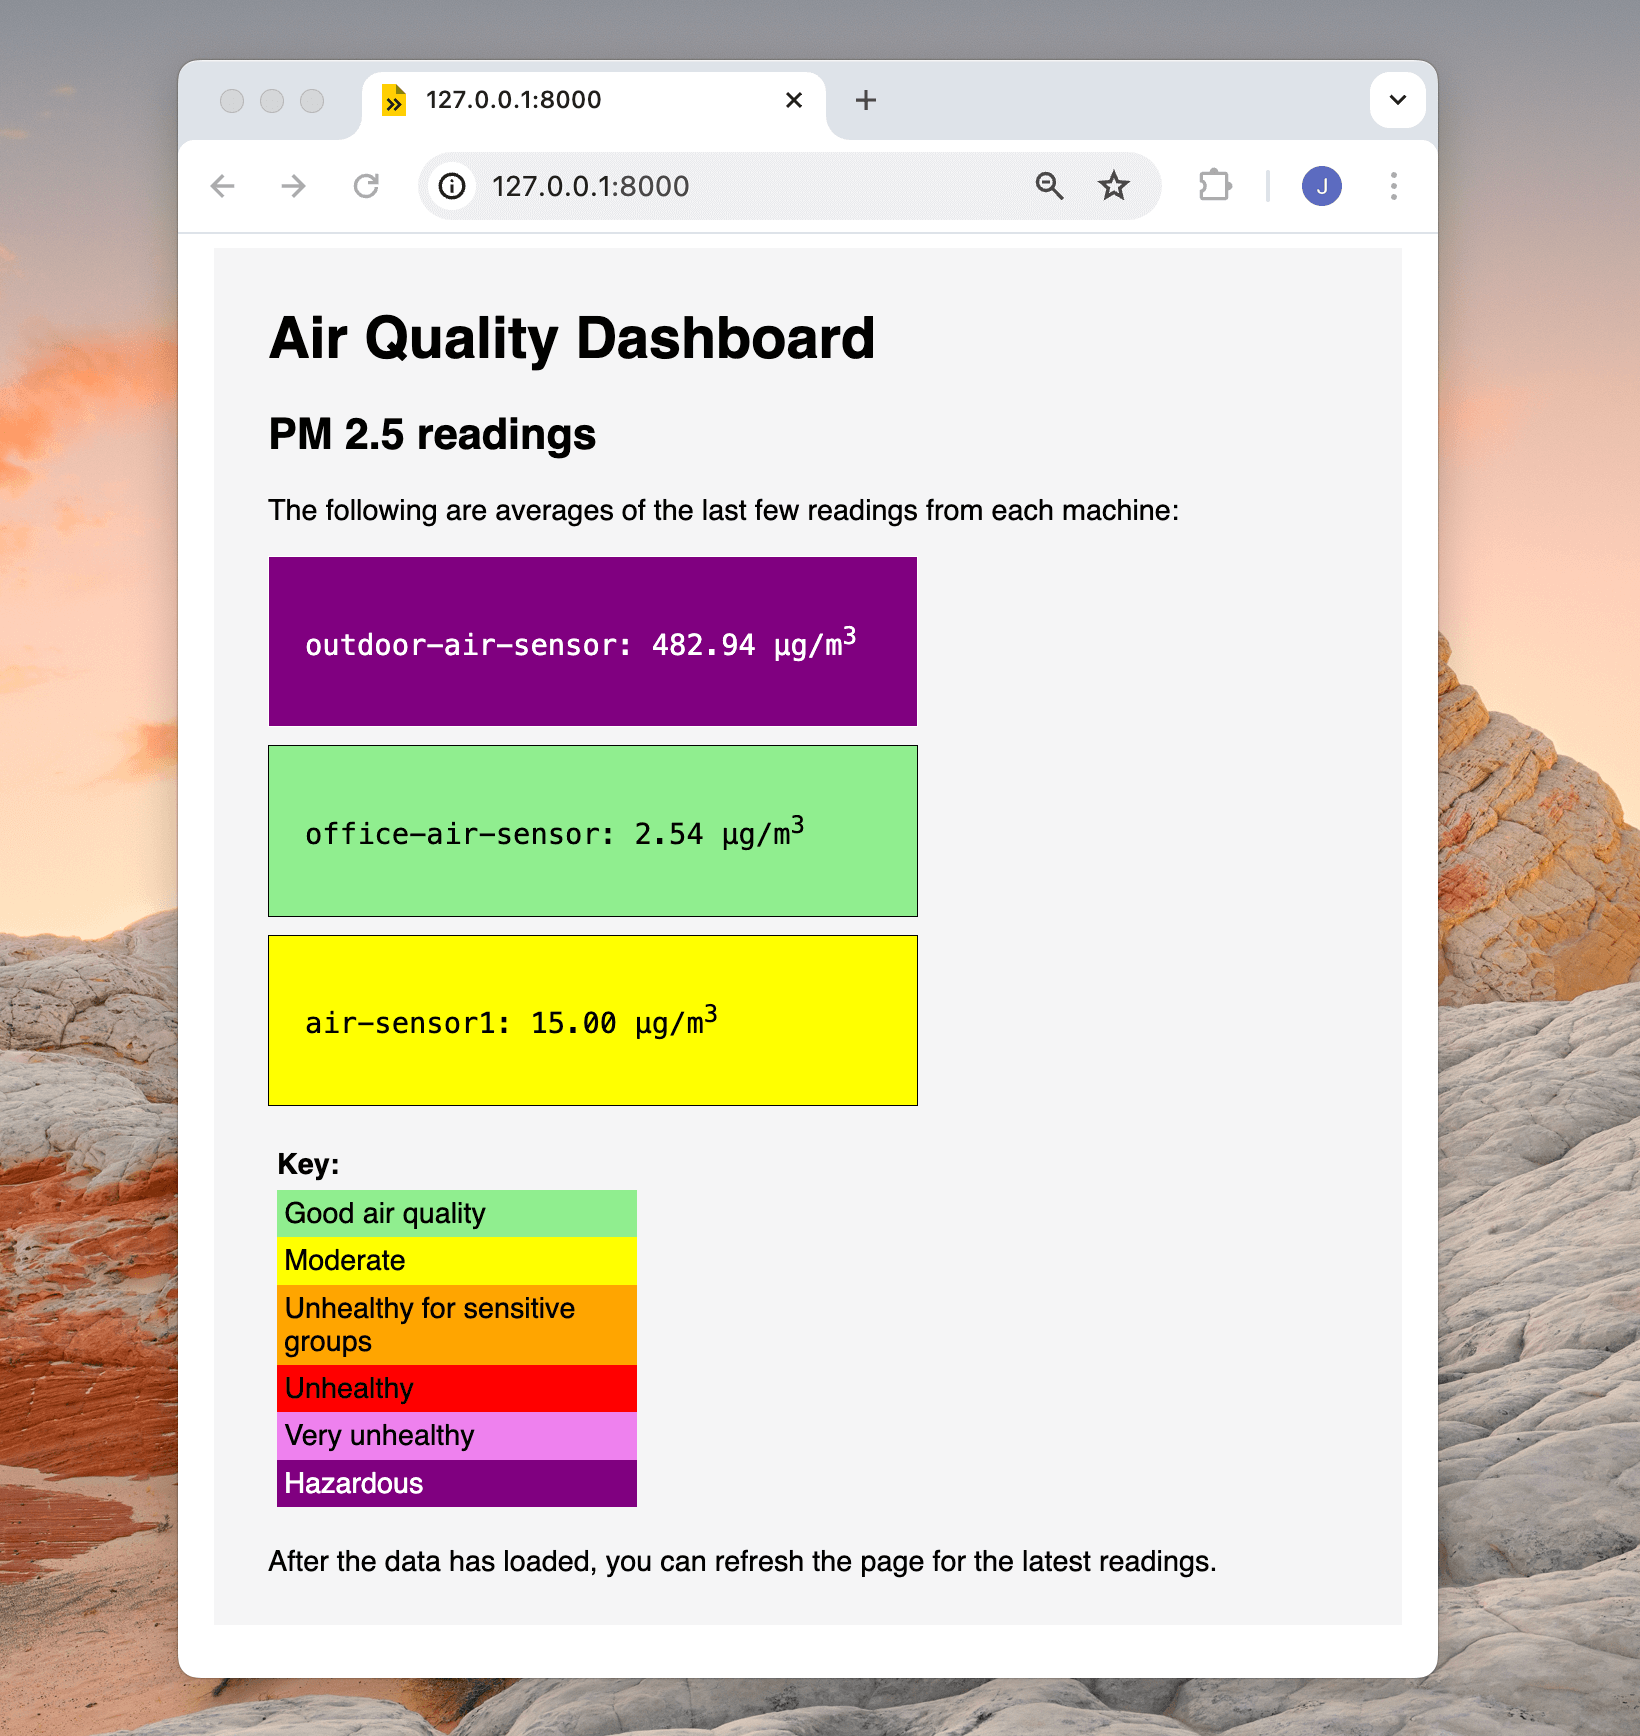
You can complete this tutorial using any number of air quality sensing machines.
For each machine, you will need the following hardware:
viam-serverMake sure all of your sensors are wired to your SBC before starting this tutorial.
Before you start connecting your devices to Viam, you’ll need to decide how you want to group your devices.
On Viam, machines are grouped into locations, and locations are grouped into organizations:
These groupings allow you to manage permissions; you can grant a user access to an individual machine, to all the machines in a location, or to everything in an entire organization. You choose how to group your machines.
For more information, see Fleet Management.
Imagine you create an air quality monitoring company called Pollution Monitoring Made Simple. Anyone can sign up and order one of your sensing machines. When a new customer signs up, you assemble a new machine with a sensor, SBC, and power supply.
Before shipping the sensor machine to your new client, you connect the machine to Viam and configure it. To manage all your company’s air quality sensing machines together, you create one organization called Pollution Monitoring Made Simple. Inside that organization, you create a location for each customer. You have some individual customers, for example Antonia, who have a sensor machine in their home, or perhaps one inside and one outside. You have other customers who are businesses, for example RobotsRUs, who have two offices, one in New York and one in Oregon, with multiple sensor machines in each. RobotsRUs wants to separate their sensor data by physical location, so you create a location for RobotsRUs and then create sub-locations to group their New York sensor machines and their Oregon machines.
When you grant Antonia access to her location, she will be able to view data from the air sensors at her home. When you grant RobotsRUs access to their location, they will be able to view data from all of their sub-locations, or they can choose to spin up a dashboard showing data from only one sub-location at a time. You, as the organization owner, will be able to manage any necessary configuration changes for all air sensing machines in all locations created within the Pollution Monitoring Made Simple organization.
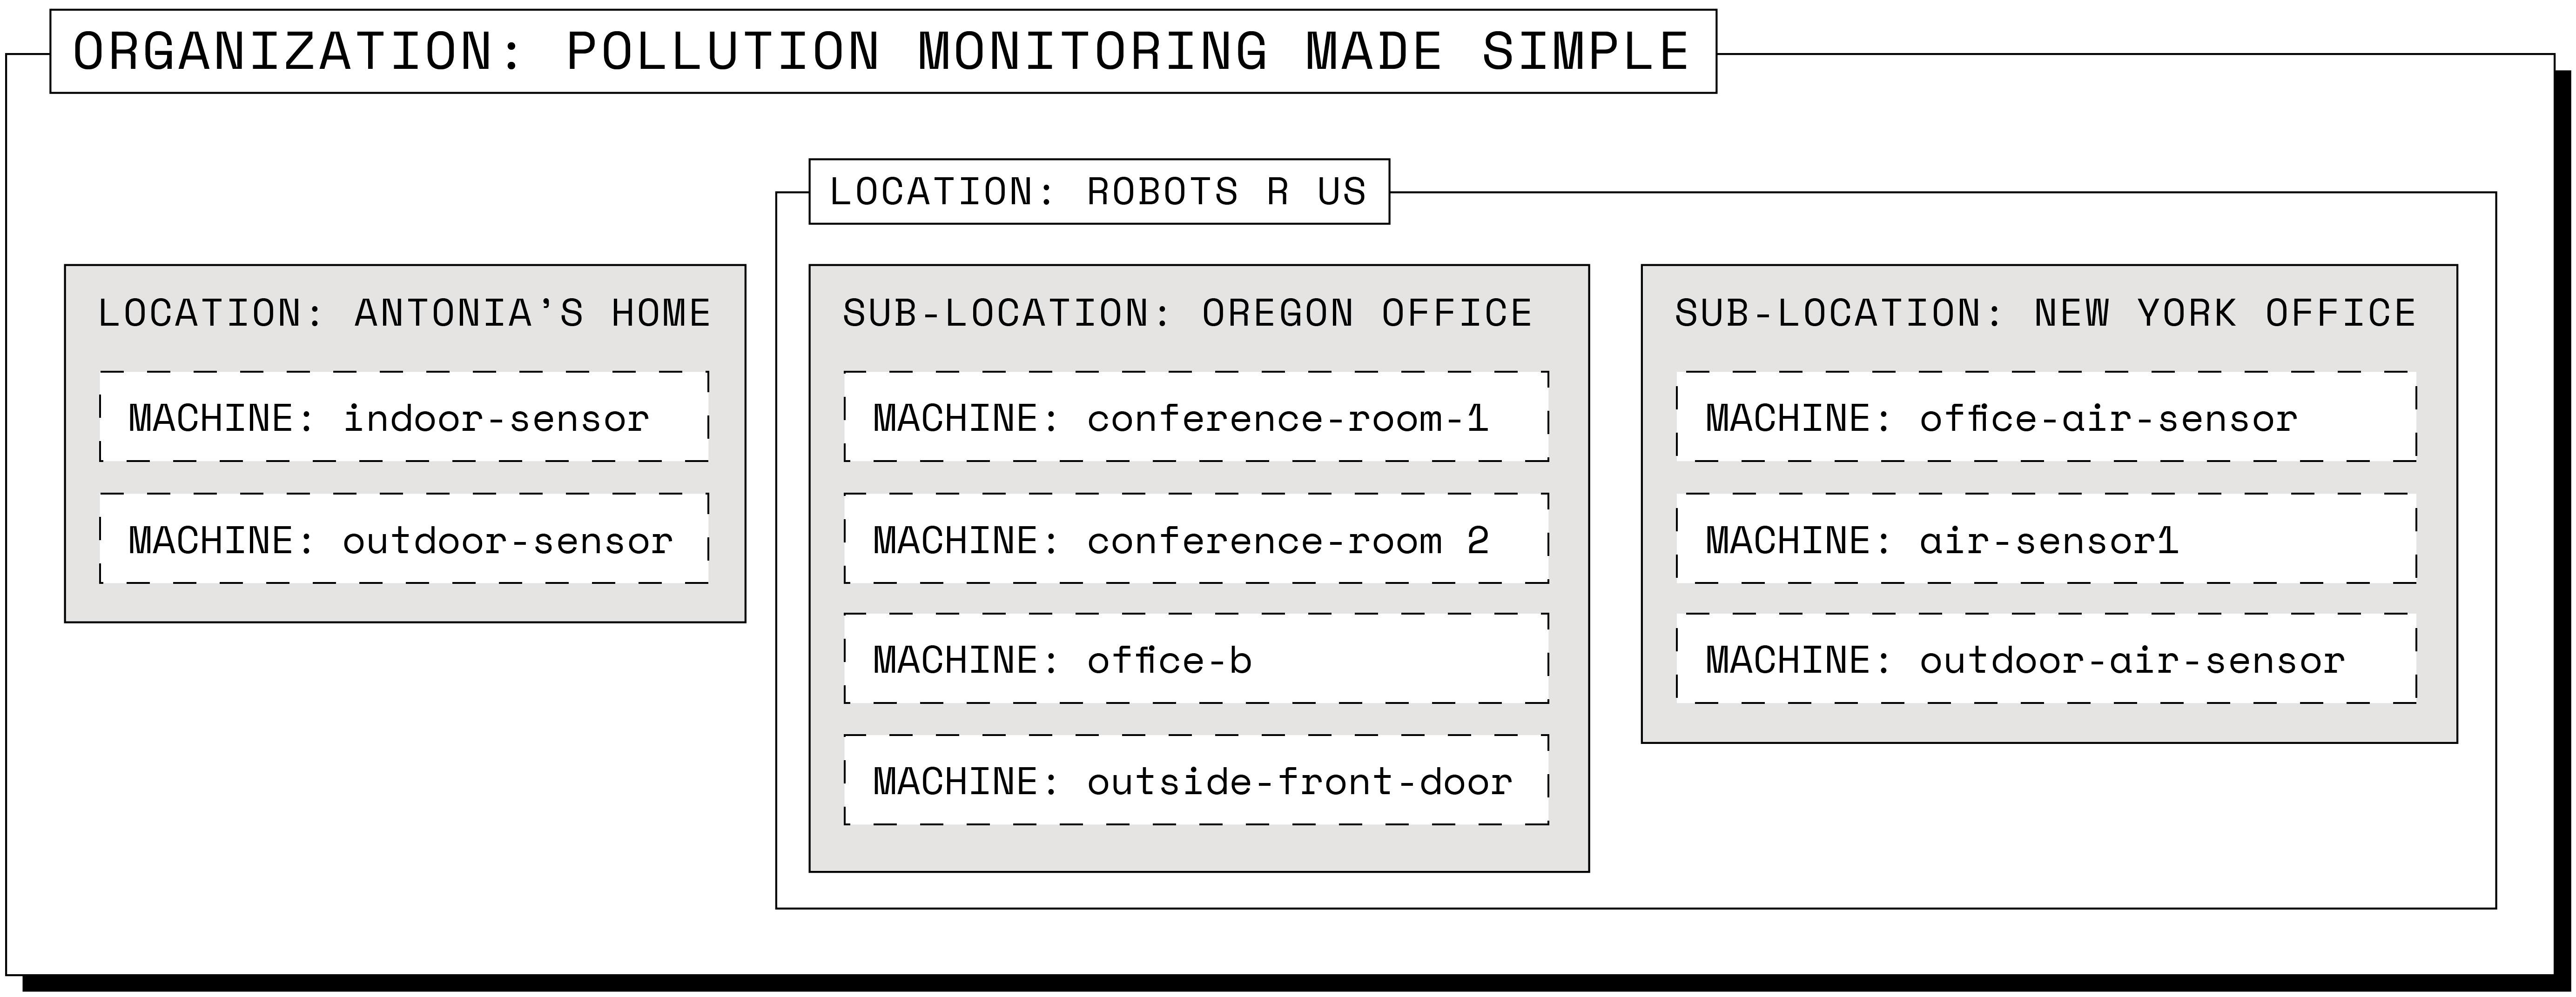
For this tutorial, we will walk through how to set up your fleet based on the example above. You can choose to manage your fleet of machines differently based on what makes sense for your use case; if you’re only configuring one or two sensors for personal use, feel free to add all your machines to one location and skip to the next section.
Create a Viam account and log into Viam.
Click the dropdown in the upper-right corner of the FLEET page and use the + button to create a new organization for your air quality machine company. Name the organization and click Create.
Click FLEET in the upper-left corner of the page and click LOCATIONS.
A new location called First Location is automatically generated for you.
Rename it so you can use it for Antonia’s machines:
Use the … menu next to edit the location name to Antonia's Home, then click Save.
Now, create a separate location for RobotsRUs:
On the left side of the LOCATIONS page, click the Add location button.
Type in RobotsRUs and click Add.
Add sub-locations to the RobotsRUs location to group the machines at each of their offices:
Add a new location called Oregon Office using the same Add location button.
Then, find the New parent location dropdown on the Oregon Office page.
Select RobotsRUs and click Change.
Repeat to add the New York office: Add a new location called New York Office, then change its parent location to RobotsRUs.
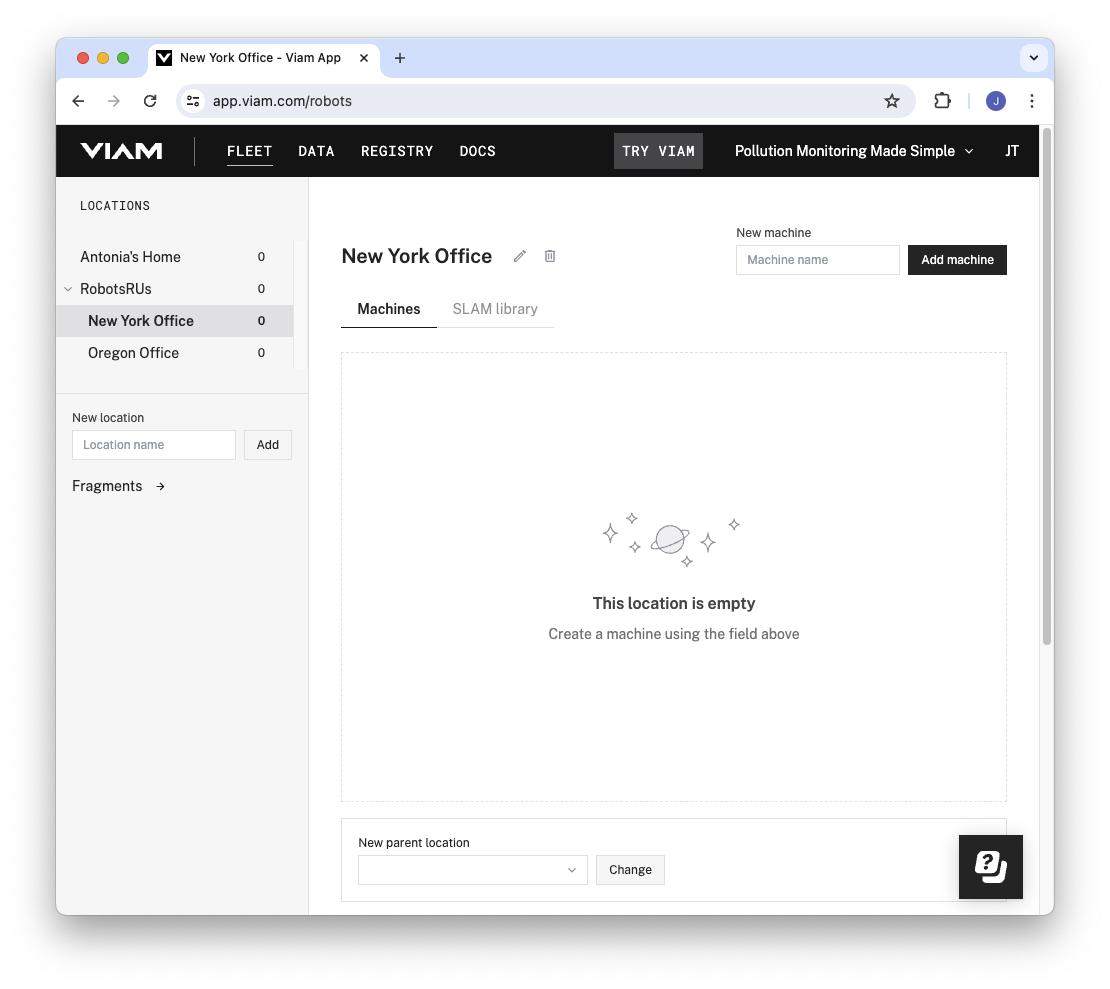
In the next section, you’ll add machines to the locations.
With your organizational structure in place, let’s add some machines:
Connect your first single-board computer to power.
For this tutorial, we’ll treat this as the machine for our first customer, Antonia.
If the computer does not already have a Viam-compatible operating system installed, follow the operating system setup section of the Quickstart guide to install a compatible operating system.
You do not need to follow the “Install viam-server” section; you will do that in the next step!
Enable serial communication so that the SBC can communicate with the air quality sensor.
For example, if you are using a Raspberry Pi, SSH to it and enable serial communication in raspi-config.
Click Antonia’s Home in the left navigation menu to navigate to that location’s page.
In the New machine field near the top-right corner of the screen, type in a name for the machine, such as Home Air Quality Sensor, and click Add machine.
You’ll be taken to the machine details page and prompted to set up your machine part. Click View setup instructions. You can find these instructions later if you need them by clicking the part status indicator (which currently reads Awaiting setup).
Follow the Set up your machine part instructions to install viam-server on the machine and connect it to Viam.
viam-server is the binary that runs on the single-board computer (SBC), providing functionality including sensor data collection and connection to Viam.
The setup page will indicate when the machine is successfully connected.
If Antonia has more than one air sensing machine, add a new machine to her location and set it up in the same way.
This is how you set up one machine.
If you are following along for the RobotsRUs business from our example, create additional machines in each sub-location, that is, in the Oregon Office location and in the New York Office location.
If this were a real company and you were shipping air sensing machines to customers, you would have the customer plug in power to the machine wherever they are setting it up.
Since you already installed viam-server, once a customer connects the machine to power and sets up wifi, the machine will automatically re-connect to Viam and pull any configuration updates.
For each sensing machine:
Connect the PM sensor to a USB port on the machine’s SBC.
Position your sensing machines in strategic locations, and connect them to power. Here are some ideas for where to place sensing machines:
You need to configure your hardware so that each of your machines can communicate with its attached air quality sensor.
No matter how many sensing machines you use, you can configure them efficiently by using a reusable configuration block called a fragment. Fragments are a way to share and manage identical machine configurations across multiple machines. Instead of going through all the configuration steps for each machine, you’ll start by configuring just one machine and create a fragment based on that machine’s configuration. Then, you’ll add the fragment to each of your machines. With all your machines configured using the same fragment, if you need to update the config in the future, you can just update the fragment and all machines will automatically get the update.
If this was a real company, adding the fragment to each individual machine would quickly become tiring. We’re showing you how to do this manually as a learning device. Once you understand how to configure machines and use fragments, you can use Provisioning to automatically set up your devices.
Navigate to the CONFIGURE tab of the machine details page for your first machine.
Click the + (Create) button and click Component or service from the dropdown.
Click sensor, then search for sds011 and click sds001:v1 from the results.
Click Add module. This adds the module that provides the sensor model that supports the specific hardware we are using for this tutorial.
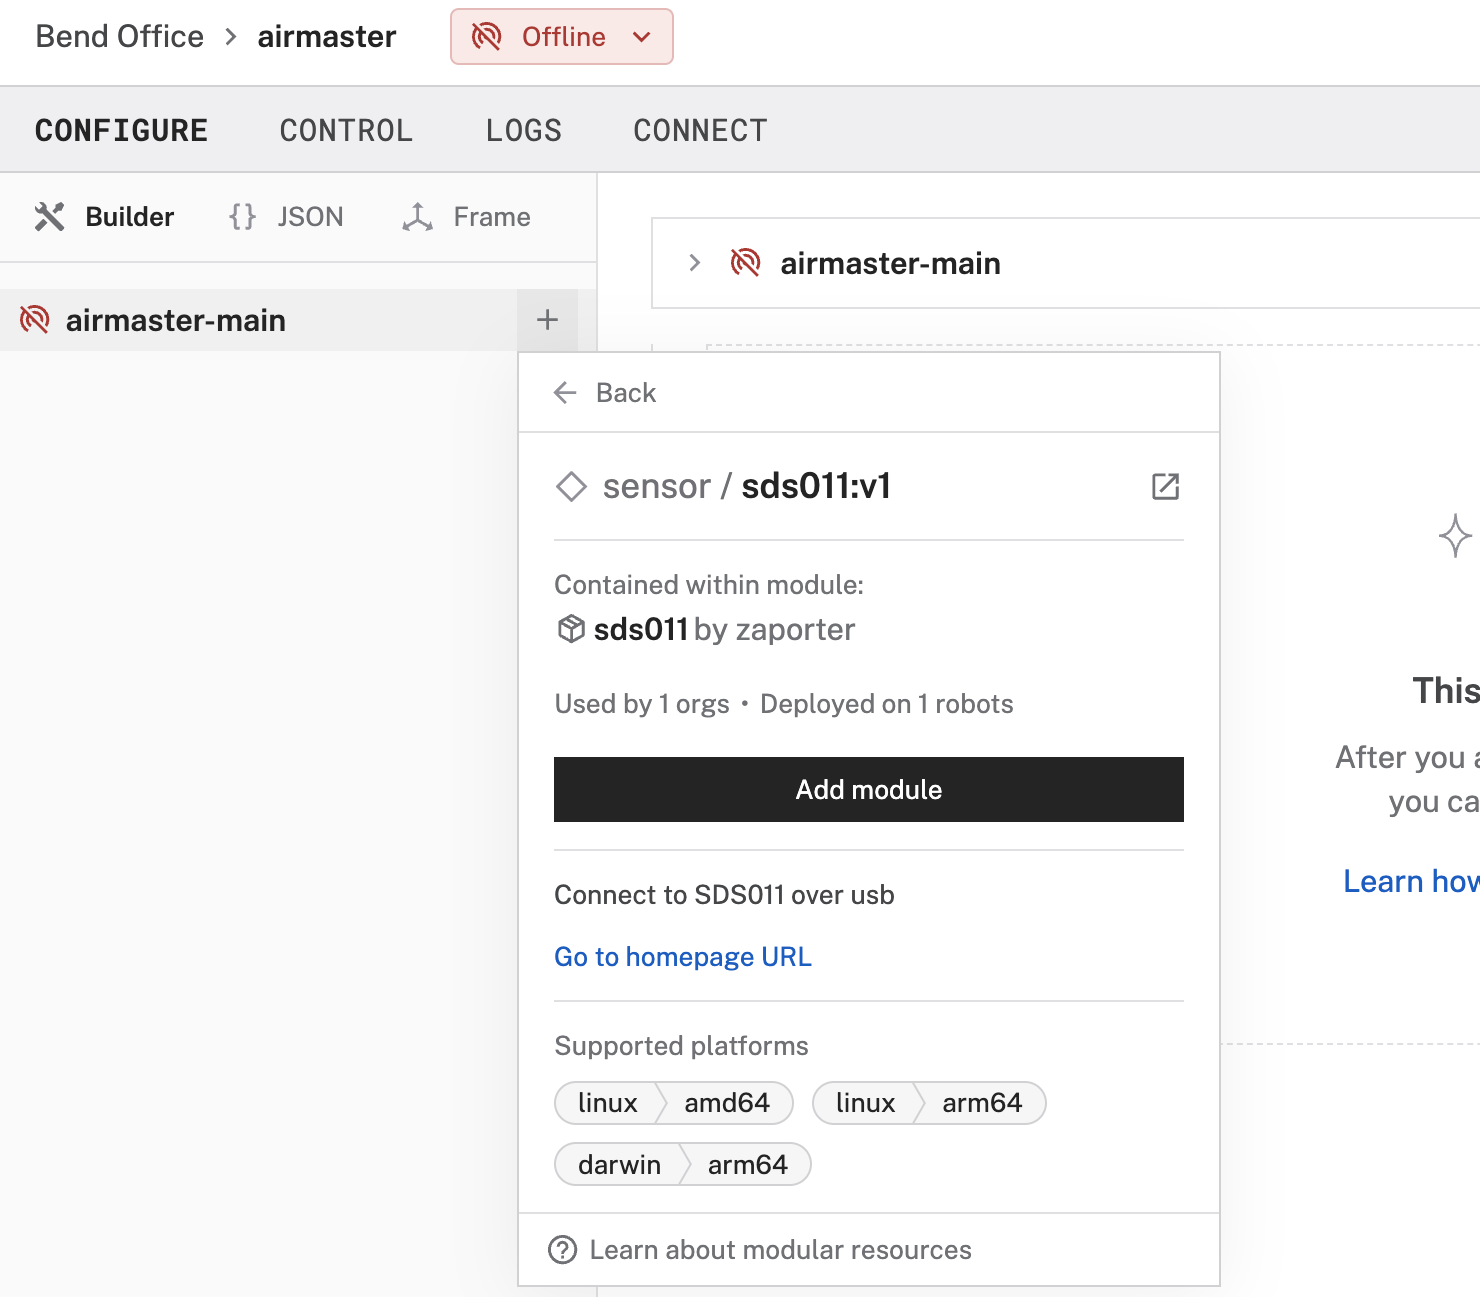
Give the sensor a name like PM_sensor and click Create.
In the newly created PM_sensor card, replace the contents of the attributes box (the empty curly braces {}) with the following:
{
  "usb_interface": "<REPLACE WITH THE PATH YOU IDENTIFY>"
}
Now you need to figure out which port your sensor is connected to on your board. SSH to your board and run the following command:
ls /dev/serial/by-id
This should output a list of one or more USB devices attached to your board, for example usb-1a86_USB_Serial-if00-port0.
If the air quality sensor is the only device plugged into your board, you can be confident that the only device listed is the correct one.
If you have multiple devices plugged into different USB ports, you may need to choose one path and test it, or unplug something, to figure out which path to use.
Now that you have found the identifier, put the full path to the device into your config, for example:
{
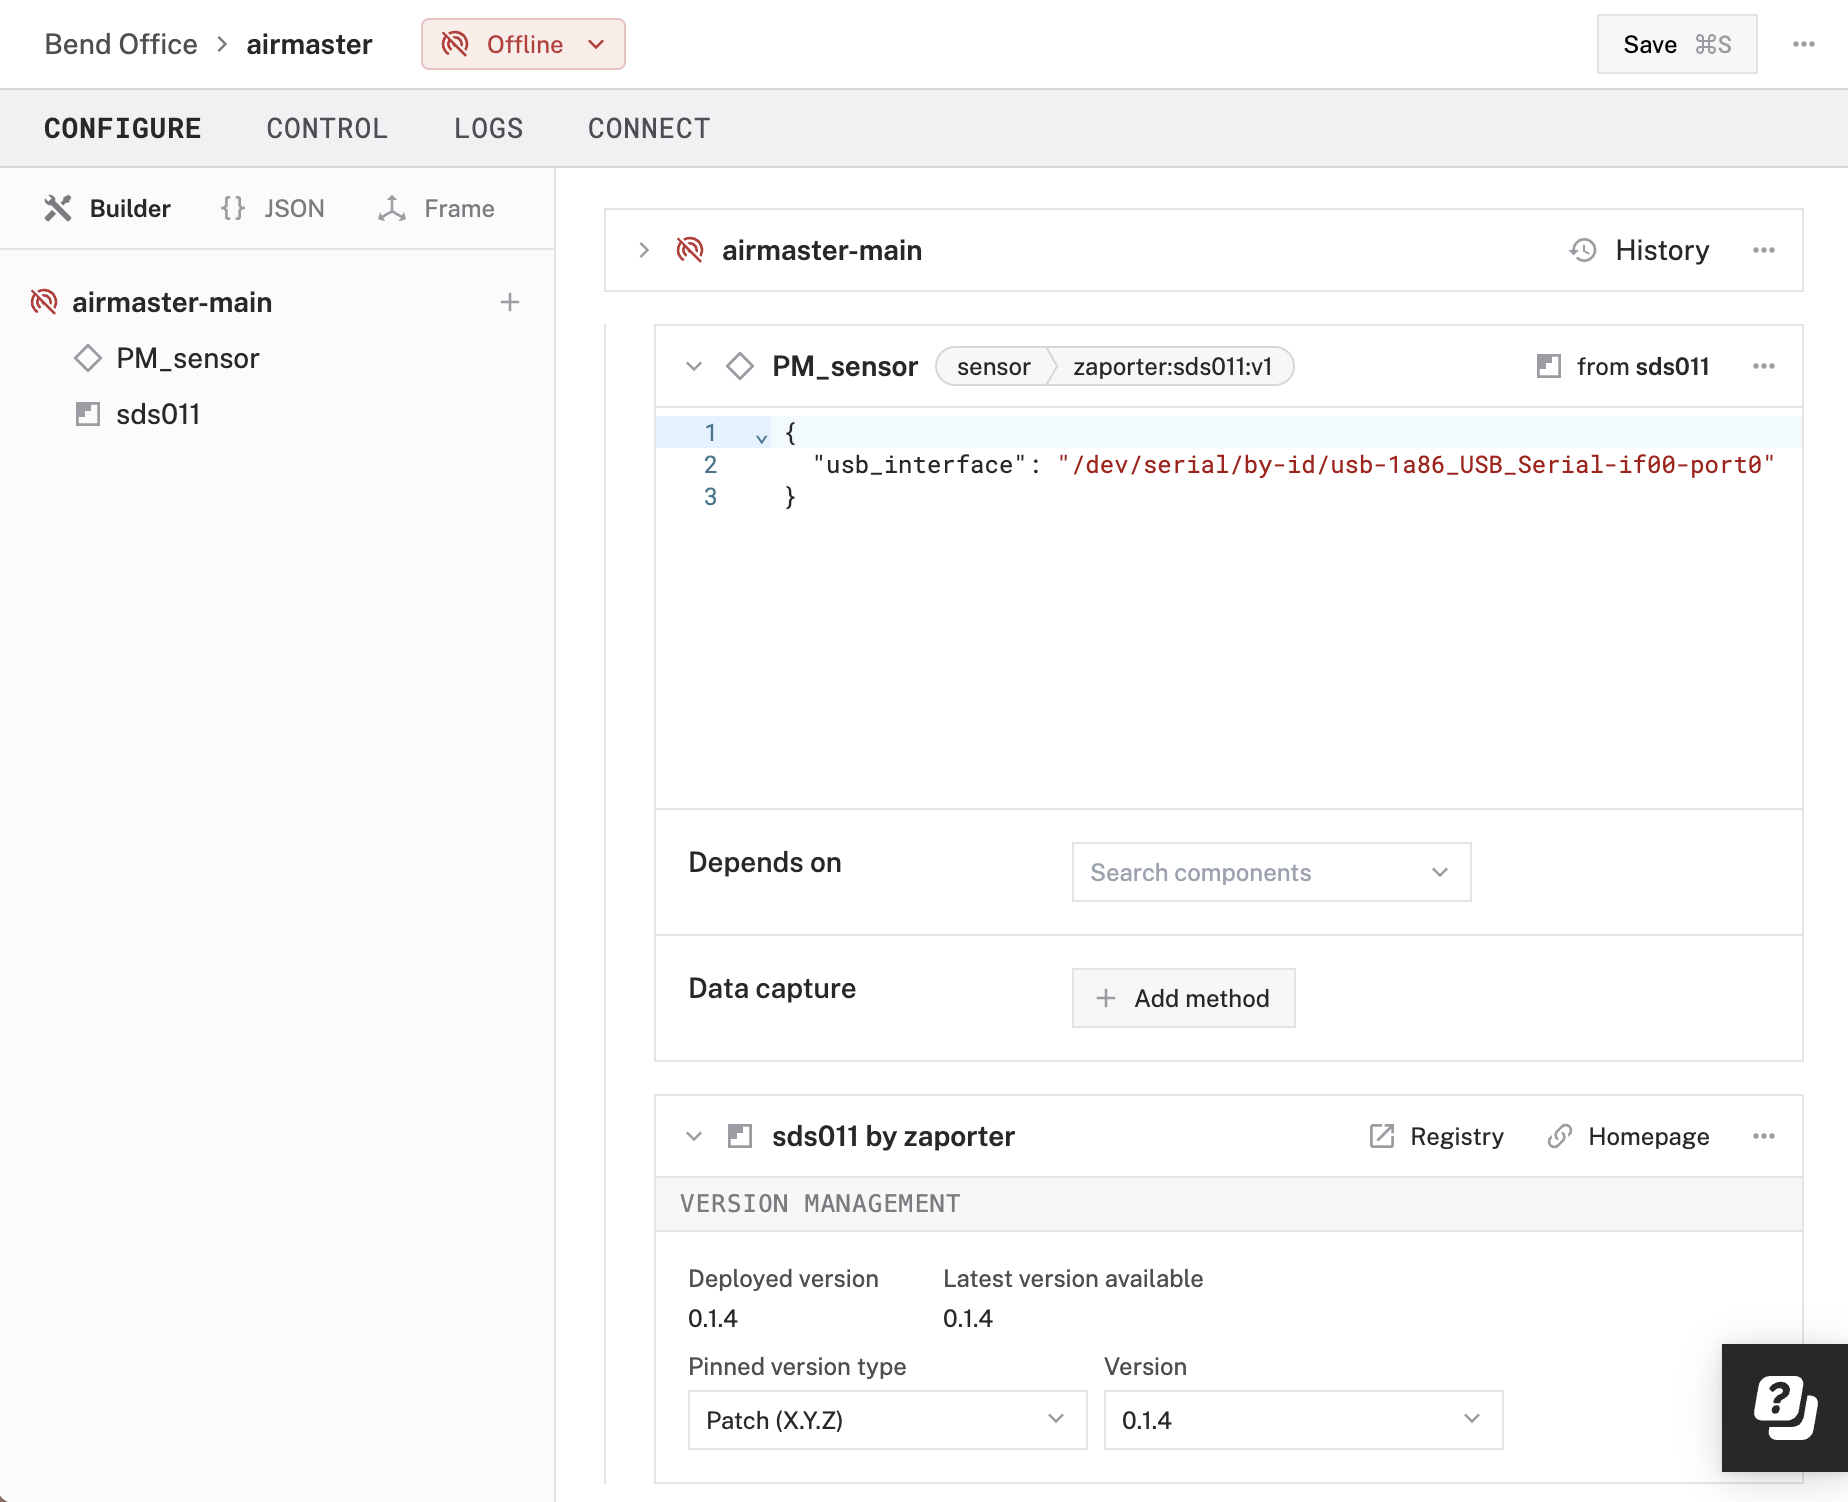
  "usb_interface": "/dev/serial/by-id/usb-1a86_USB_Serial-if00-port0"
}
Save the config. Your machine config should now resemble the following:
You have configured the sensor so the board can communicate with it, but sensor data is not yet being saved anywhere. Viam’s data management service lets you capture data locally from each sensor and then sync it to the cloud where you can access historical sensor data and see trends over time. Once you configure the rest of your sensing machines, you’ll be able to remotely access data from all sensors in all locations, and when you’re ready, you can give customers access to the data from the sensors in their locations.
Configure data capture and sync as follows:
data_manager-1 and click Create.0.05 minutes so that data syncs to the cloud every 3 seconds.
You can change the interval if you like, just don’t make it too long or you will have to wait a long time before you see your data!air-quality and click + Tag: air-quality when it appears to create a new tag.
This tag will now automatically be applied to all data collected by this data manager.0.1 readings per second.
This will capture air quality data once every ten seconds.
It is useful to capture data frequently for testing purposes, but you can always change this frequency later since you probably don’t need to capture data this frequently all day forever.If you are only using one air quality sensing machine for this tutorial, you do not need to create or use fragments, since fragments are useful only when configuring multiple machines. You can skip to Test your sensors.
While you configured your machine with the builder UI, Viam generated a JSON configuration file with all your parameters.
This is the file that tells viam-server what resources are available to it and how everything is connected.
Click JSON in the upper-left corner of the CONFIGURE tab to view the generated JSON file.
You can manually edit this file instead of using the builder UI if you are familiar with JSON.
In any case, now that the JSON is generated, you are ready to create a fragment:
Select and copy the entire contents of the JSON config.
Navigate to the FLEET page and go to the FRAGMENTS tab.
Click Create fragment and change your fragment’s name by clicking on it. We used the name air-sensing-machine.
Replace the empty curly braces {} with the config you copied from your machine.
Click Save.
Now, you can actually delete the entire config from your machine! In the next section, you will replace it with the fragment you just created so that it gets updated alongside all your other machines when you update the fragment in the future.
Navigate back to your machine’s CONFIGURE tab, select JSON mode, and delete the entire contents of the config.
When you try to save, you’ll get an invalid JSON error because it can’t be empty.
Put in a set of curly braces {} and then save the config successfully.
Add the fragment you just created to each of your machines including the first one:
Click the + button, then click Insert fragment in the dropdown menu.
Search for and click the name of your fragment, for example air-sensing-machine.
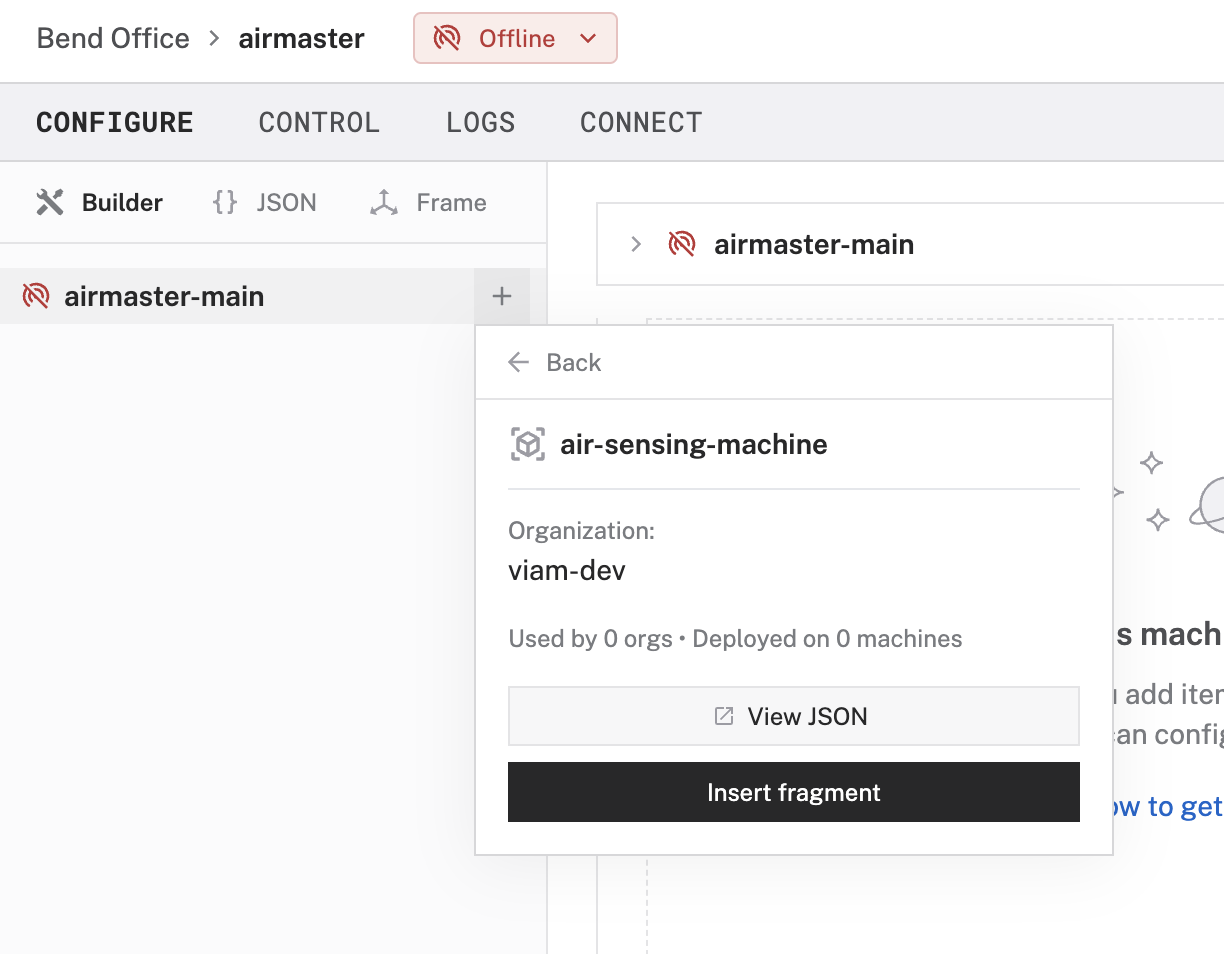
Click Insert fragment. The module, sensor, and data manager will appear in your config.
Save the config.
Repeat these steps on the machine details page for each of your air quality sensing machines.
Now that all your hardware is configured, it’s a good idea to make sure readings are being gathered by the sensors and sent to the cloud before proceeding with the tutorial. For each machine:
Go to the machine details page and navigate to the CONTROL tab.
Within the Sensors section, click Get Readings for the PM_sensor. If the sensor software and hardware is working, you should see values populate the Readings column.

If you do not see readings, check the LOGS tab for errors, double-check that serial communication is enabled on the single board computer, and check that the usb_interface path is correctly specified (click below).
Next, check that data is being synced from your sensors to the cloud:
Open your DATA page.
Click the Sensors tab within the data page.
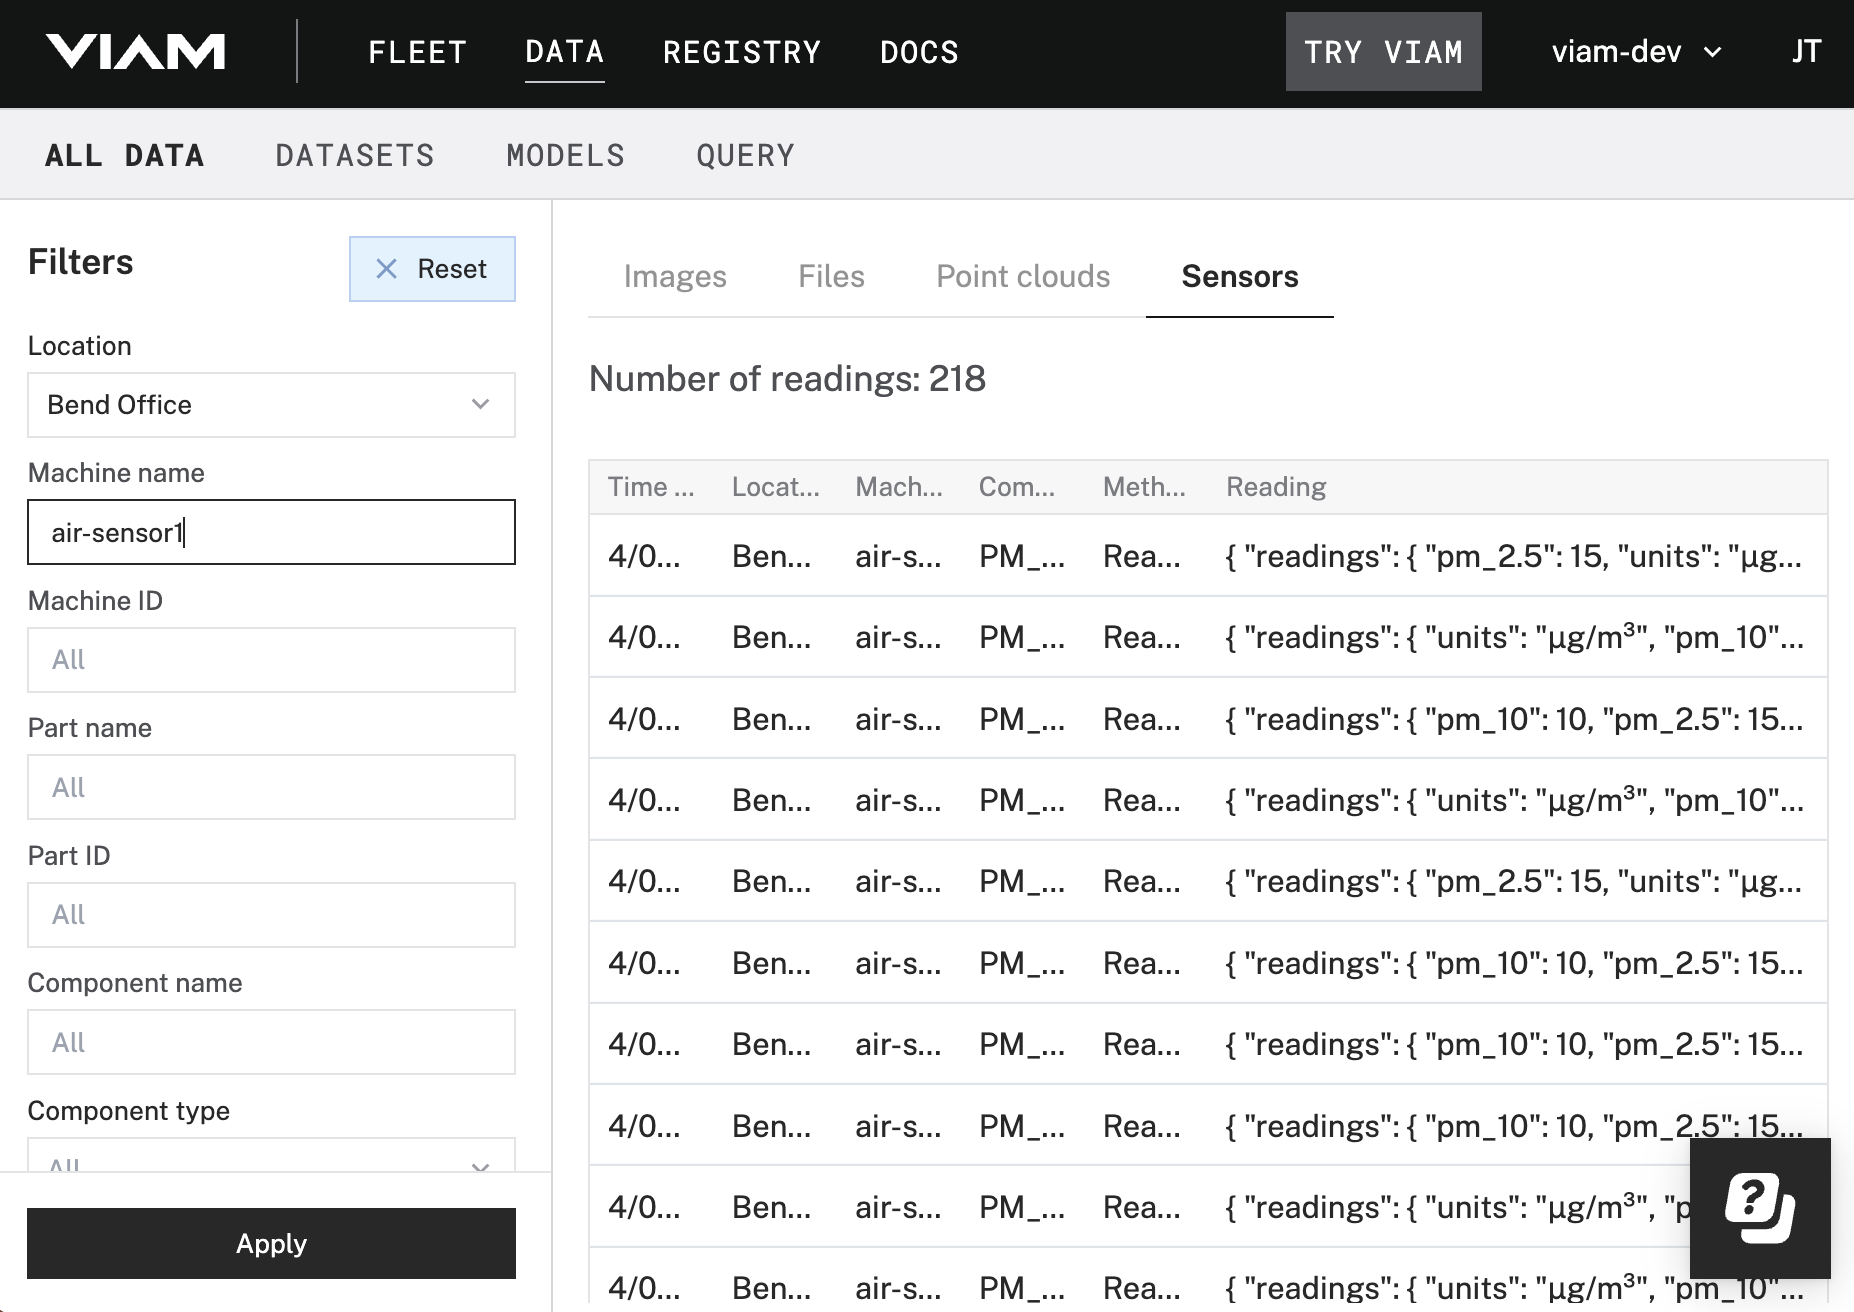
If you have sensor data coming from machines unrelated to this project, use the filters on the left side of the page to view data from only your air quality sensors.
Click the Tags dropdown and select the air-quality tag you applied to your data.
You can also use these filters to show the data from one of your air quality sensors at a time by typing a machine name into the Machine name box and clicking Apply in the lower-left corner.
Once you’ve confirmed that data is being collected and synced correctly, you’re ready to start building a dashboard to display the data. If you’d like to graph your data using a Grafana dashboard, try our Visualize Data with Grafana tutorial. If you’d like to create your own customizable dashboard using the Viam TypeScript, continue with this tutorial.
The Viam TypeScript SDK allows you to build custom web interfaces to interact with your machines. For this project, you’ll use it to build a page that displays air quality sensor data for a given location. You’ll host the website locally on your personal computer, and view the interface in a web browser on that computer.
As you’ll find out in the authentication step, you can set each customer up with credentials to access the data from only their location, or you can create a dashboard showing data from all sensors in your entire organization.
Complete the following steps on your laptop or desktop.
You don’t need to install or edit anything else on your machine’s single-board computer (aside from viam-server which you already did); you’ll be running the TypeScript code from your personal computer.
Make sure you have the latest version of Node.JS installed on your computer.
Install the Viam TypeScript SDK by running the following command in your terminal:
npm install --save @viamrobotics/sdk
Create a directory on your laptop or desktop for your project.
Name it
Create a file in your
{
  "name": "air-quality-dashboard",
  "description": "A dashboard for visualizing data from air quality sensors.",
  "scripts": {
    "start": "esbuild ./main.ts --bundle --outfile=static/main.js --servedir=static --format=esm",
    "test": "echo \"Error: no test specified\" && exit 1"
  },
  "author": "<YOUR NAME>",
  "license": "ISC",
  "devDependencies": {
    "esbuild": "*"
  },
  "dependencies": {
    "@viamrobotics/sdk": "^0.13.0",
    "bson": "^6.6.0"
  }
}
The --format=esm flag in the "start" script is important because the ECMAScript module format is necessary to support the BSON dependency this project uses for data query formatting.
If you don’t know what the proceeding sentence means, don’t worry about it; just copy-paste the JSON above and it’ll work.
Your TypeScript code requires an API key to establish a connection to your machines. You can set up credentials to access data from all the sensor machines in your organization, or from just one location. These API keys only need Operator permissions.
In our example you could create a dashboard for Antonia with an API key to see the data from her location, and create a separate dashboard for RobotsRUs with a different API key to access the data from their location. If RobotsRUs wanted to separate their dashboards by sub-locations, you could set up API keys for RobotsRUs to access data for each of their sub-locations separately, or you could modify the example code to filter data by location name.
You can then either deploy each dashboard on a web server you manage, or add a web server on one machine per customer that hosts the dashboard for the respective customer so that they can access their data on their local network. We leave this step to the reader.
The following instructions describe how to set up an API key for one location.
Create another file inside the
// Air quality dashboard

import * as VIAM from "@viamrobotics/sdk";
import { BSON } from "bson";

async function main() {
  const opts: VIAM.ViamClientOptions = {
    credential: {
      type: "api-key",
      // Key with location operator permissions
      // Replace <API-KEY> (including angle brackets)
      payload: "<API-KEY>",
      // Replace <API-KEY-ID> (including angle brackets)
      authEntity: "<API-KEY-ID>",
    },
  };

  const orgID: string = "<ORGANIZATION ID>"; // Replace
  const locationID: string = "<LOCATION ID>"; // Replace

  // <Insert data client and query code here in later steps>

  // <Insert HTML block code here in later steps>
}

// <Insert getLastFewAv function definition here in later steps>

main().catch((error) => {
  console.error("encountered an error:", error);
});
Now you need to get the API key and the organization and location IDs to replace the placeholder strings in the code you just pasted.
Navigate to the location page for the location containing your air quality machines.
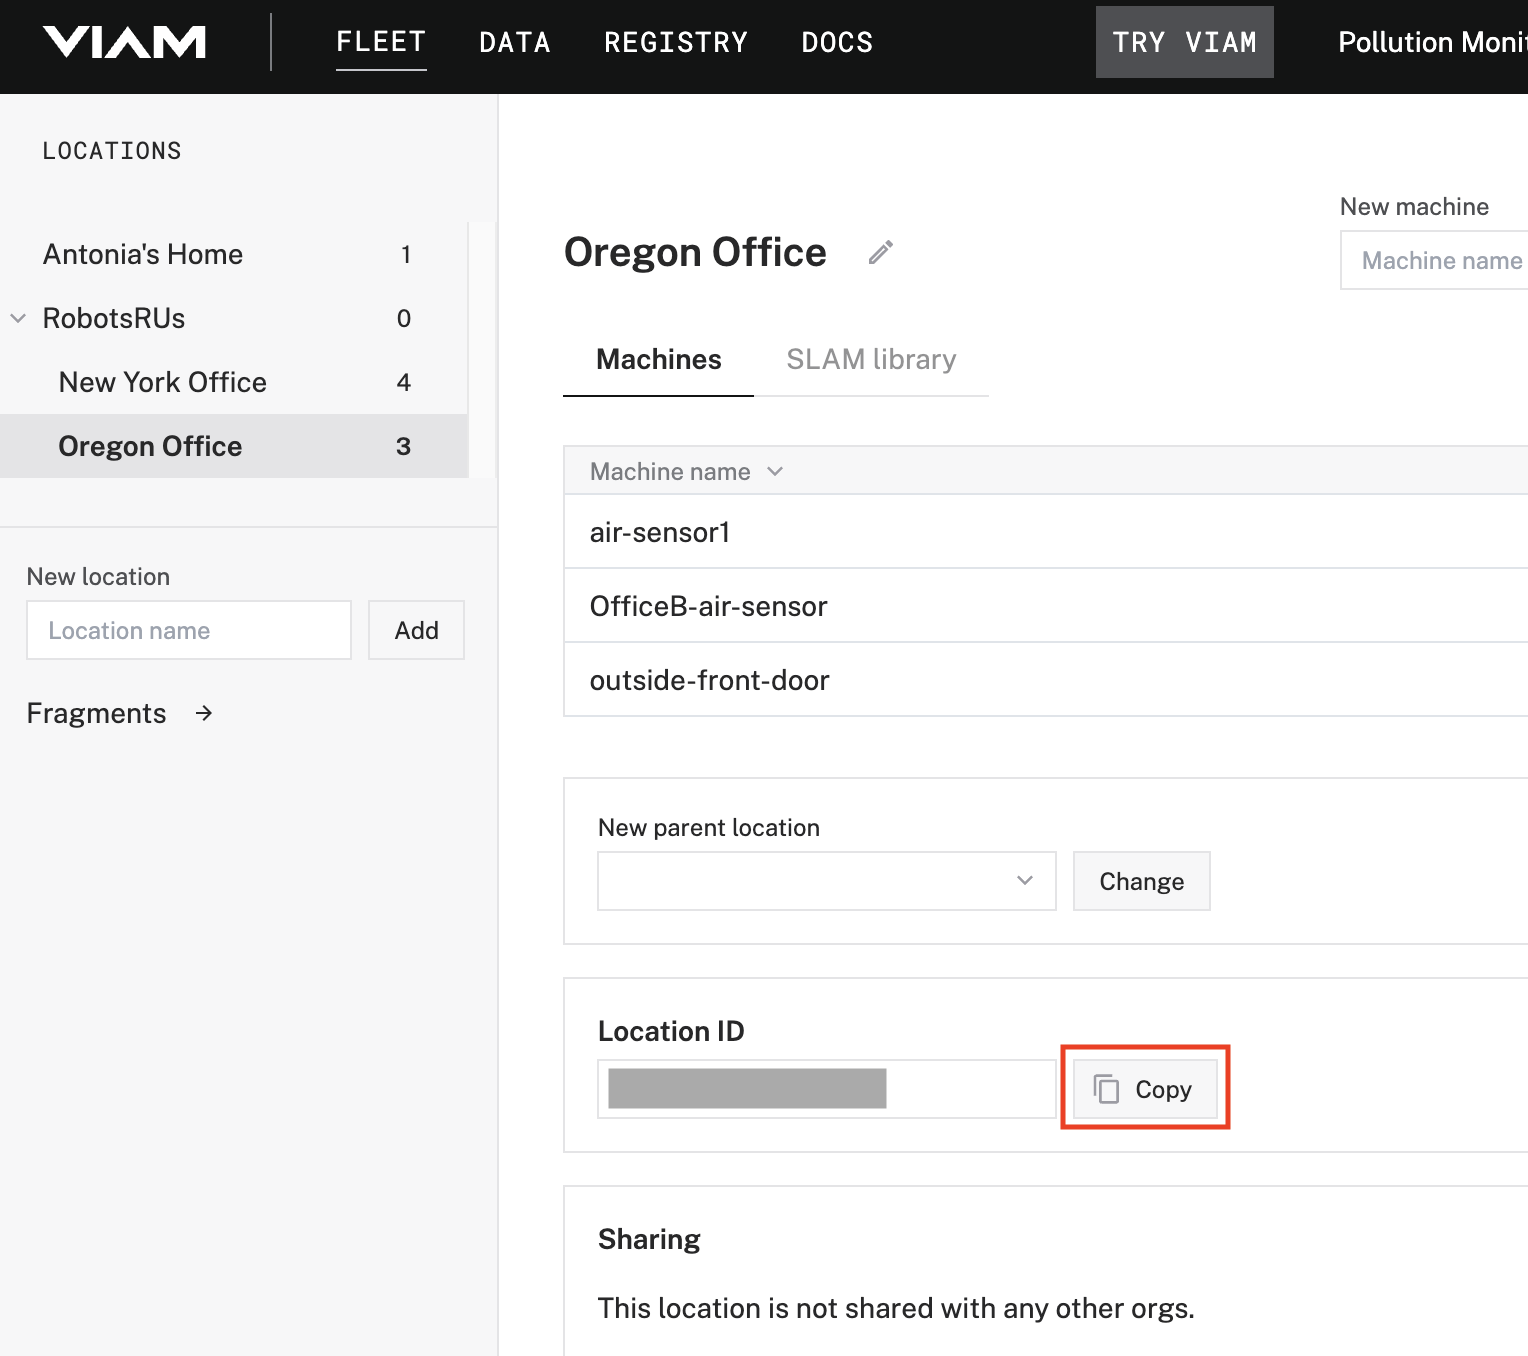
Copy the Location ID and paste it into your code in place of <LOCATION ID>, so that the line resembles const orgID: string = "abcde12345".
Use the dropdown menu in the upper-right corner of the page to navigate to your organization settings page.
Copy the Organization ID found under Details near the top of the page.
Paste it in place of <ORGANIZATION ID> in your code.
Under the API Keys heading, click Generate Key.
Name your key something such as air-sensors-key.
Select Entity and choose the location you have all your air quality sensing machines in.
Set the Role to Owner, then click Generate key.
Copy the ID and corresponding key you just created and paste them in place of <API-KEY> and <API-KEY-ID> in your code.
For example, you’ll now have something of the form
authEntity: '1234abcd-123a-987b-1234567890abc',
payload: 'abcdefg987654321abcdefghi'
We strongly recommend that you add your API key as an environment variable. Anyone with your API key can access your machine, and the computer running your machine.
Now that you have the API key and org and location IDs, you are ready to add code that establishes a connection from the computer running the code to the Viam Cloud where the air quality sensor data is stored.
You’ll create a Viam dataClient instance which accesses all the data in your location, and then query this data to get only the data tagged with the air-quality tag you applied with your data service configuration.
The following code also queries the data for a list of the machines that have collected air quality data so that later, you can make a dashboard that has a place for the latest data from each of them.
Paste the following code into the main function of your locationID line, in place of // <Insert data client and query code here in later steps>:
// Instantiate data_client and get all
// data tagged with "air-quality" from your location
const client = await VIAM.createViamClient(opts);
const myDataClient = client.dataClient;
const query = {
  $match: {
    tags: "air-quality",
    location_id: locationID,
    organization_id: orgID,
  },
};
const match = { $group: { _id: "$robot_id" } };
// Get a list of all the IDs of machines that have collected air quality data
const BSONQueryForMachineIDList = [
  BSON.serialize(query),
  BSON.serialize(match),
];
let machineIDs: any = await myDataClient?.tabularDataByMQL(
  orgID,
  BSONQueryForMachineIDList,
);
// Get all the air quality data
const BSONQueryForData = [BSON.serialize(query)];
let thedata: any = await myDataClient?.tabularDataByMQL(
  orgID,
  BSONQueryForData,
);
For this project, your dashboard will display the average of the last five readings from each air sensor. You need a function to calculate that average. The data returned by the query is not necessarily returned in order, so this function must put the data in order based on timestamps before averaging the last five readings.
Paste the following code into // <Insert getLastFewAv function definition here in later steps>:
// Get the average of the last few readings from a given sensor
async function getLastFewAv(alltheData: any[], machineID: string) {
  // Get just the data from this machine
  let thedata = new Array();
  for (const entry of alltheData) {
    if (entry.robot_id == machineID) {
      thedata.push({
        PM25: entry.data.readings["pm_2_5"],
        time: entry.time_received,
      });
    }
  }

  // Sort the air quality data from this machine
  // by timestamp
  thedata = thedata.sort(function (a, b) {
    let x = a.time.toString();
    let y = b.time.toString();
    if (x < y) {
      return -1;
    }
    if (x > y) {
      return 1;
    }
    return 0;
  });

  // Add up the last 5 readings collected.
  // If there are fewer than 5 readings, add all of them.
  let x = 5; // The number of readings to average over
  if (x > thedata.length) {
    x = thedata.length;
  }
  let total = 0;
  for (let i = 1; i <= x; i++) {
    const reading: number = thedata[thedata.length - i].PM25;
    total += reading;
  }
  // Return the average of the last few readings
  return total / x;
}
Now that you’ve defined the function to sort and average the data for each machine, you’re done with all the dataClient code.
The final piece you need to add to this script is a way to create some HTML to display data from each machine in your dashboard.
Paste the following code into the main function of // <Insert HTML block code here in later steps>:
// Instantiate the HTML block that will be returned
// once everything is appended to it
let htmlblock: HTMLElement = document.createElement("div");
// Display the relevant data from each machine to the dashboard
for (const mach of machineIDs) {
let insideDiv: HTMLElement = document.createElement("div");
let avgPM: number = await getLastFewAv(thedata, mach._id);
// Color-code the dashboard based on air quality category
let level: string = "blue";
switch (true) {
case avgPM < 12.1: {
level = "good";
break;
}
case avgPM < 35.5: {
level = "moderate";
break;
}
case avgPM < 55.5: {
level = "unhealthy-sensitive";
break;
}
case avgPM < 150.5: {
level = "unhealthy";
break;
}
case avgPM < 250.5: {
level = "very-unhealthy";
break;
}
case avgPM >= 250.5: {
level = "hazardous";
break;
}
}
// Create the HTML output for this machine
insideDiv.className = "inner-div " + level;
insideDiv.innerHTML =
"<p>" +
mach._id +
": " +
avgPM.toFixed(2).toString() +
" μg/m<sup>3</sup></p>";
htmlblock.appendChild(insideDiv);
}
// Output a block of HTML with color-coded boxes for each machine
return document.getElementById("insert-readings").replaceWith(htmlblock);
The full code is available for reference on GitHub.
You have completed the main TypeScript file that gathers and sorts the data. Now, you’ll create a page to display the data.
The complete code is available on GitHub as a reference.
Create a folder called
<!doctype html>
<html>
<head>
 <link rel="stylesheet" href="style.css">
</head>
<body>
 <div id="main">
   <div>
     <h1>Air Quality Dashboard</h1>
   </div>
   <script type="module" src="main.js"></script>
   <div>
     <h2>PM 2.5 readings</h2>
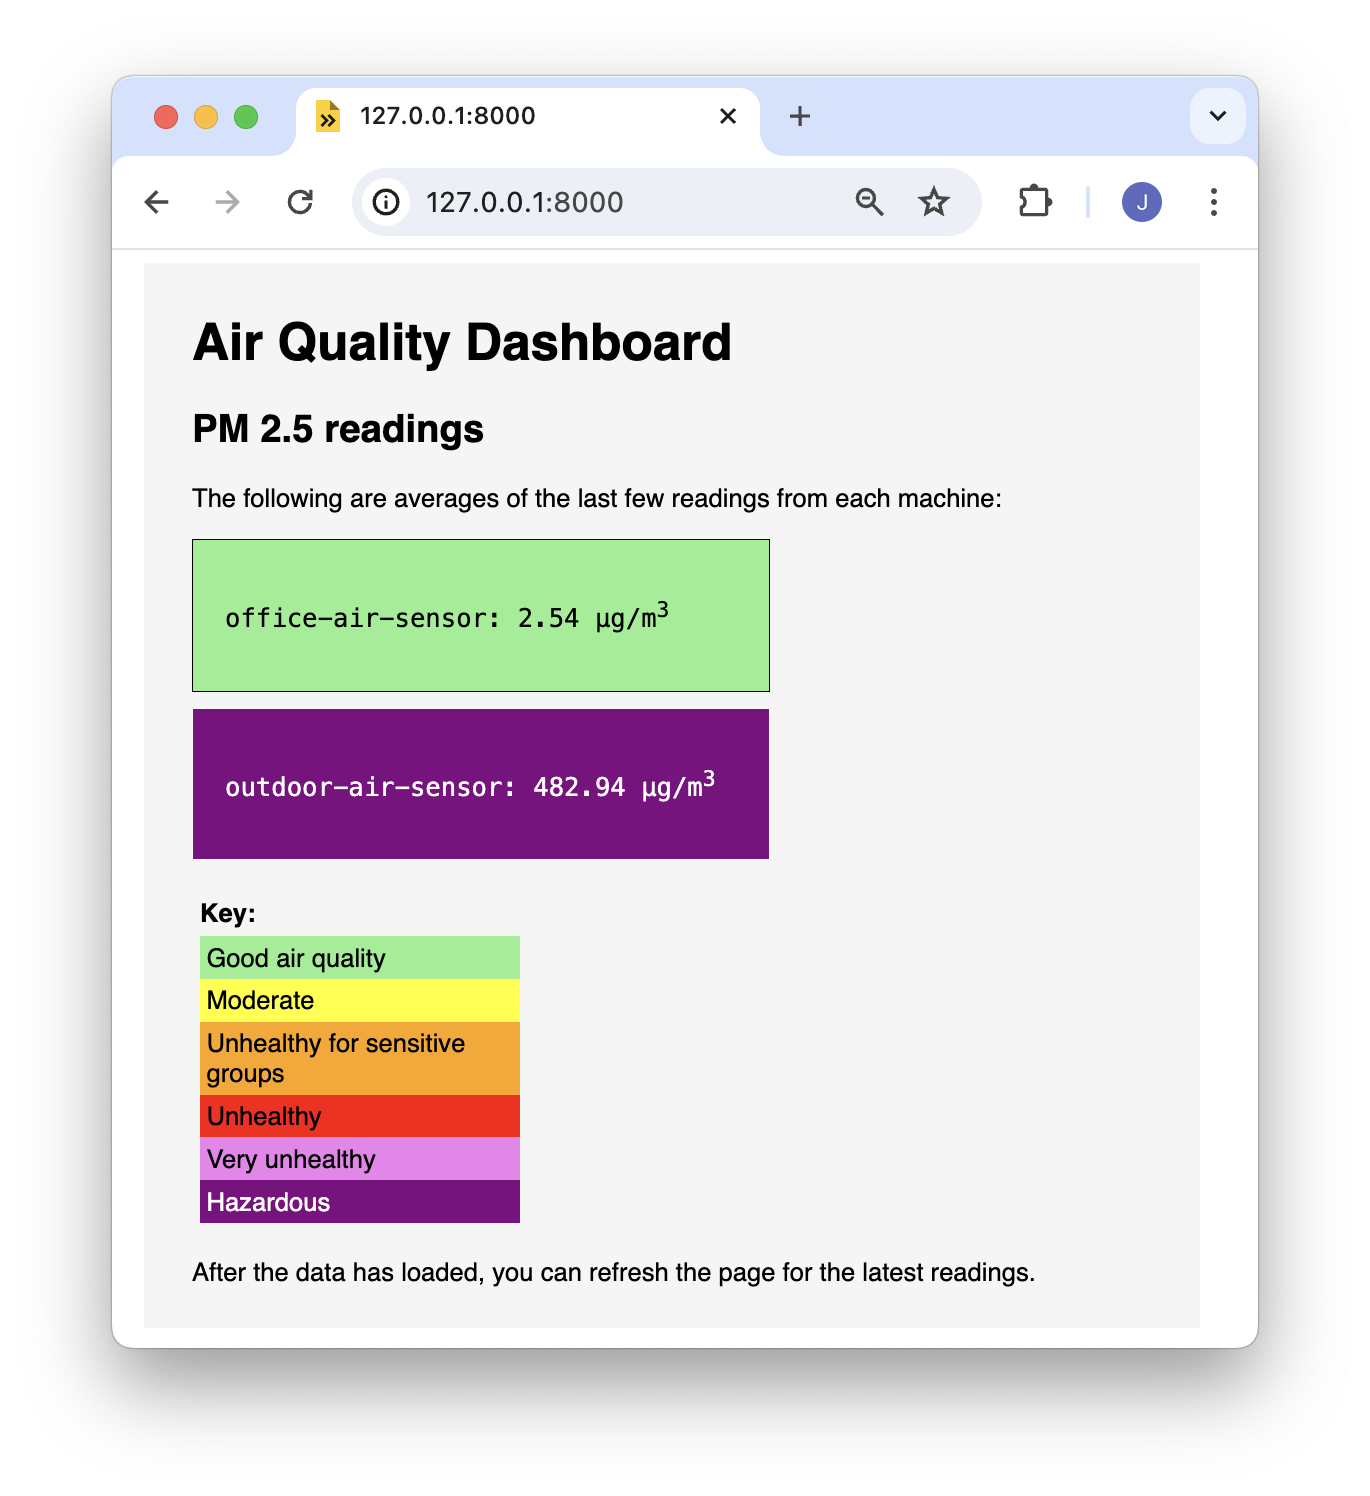
     <p>The following are averages of the last few readings from each machine:</p>
   </div>
   <div id="insert-readings">
     <p><i>Loading data...
       It may take a few moments for the data to load.
       Do not refresh page.</i></p>
   </div>
   <br>
   <div class="key">
     <h4 style="margin:5px 0px">Key:</h4>
     <p class="good">Good air quality</p>
     <p class="moderate">Moderate</p>
     <p class="unhealthy-sensitive">Unhealthy for sensitive groups</p>
     <p class="unhealthy">Unhealthy</p>
     <p class="very-unhealthy">Very unhealthy</p>
     <p class="hazardous">Hazardous</p>
   </div>
   <p>
     After the data has loaded, you can refresh the page for the latest readings.
   </p>
 </div>
</body>
</html>
Line 11, highlighted above, is where the HTML output of the TypeScript file
TypeScript is a superset of JavaScript with added functionality, and it transpiles to JavaScript, which is why your file is called src="main.js".
If you look at line 5 of ./main.ts builds out to static/main.js.
Now you’ll create a style sheet to specify the fonts, colors, and spacing of your dashboard.
Create a new file inside your
Paste the following into
body {
  font-family: Helvetica;
  margin-left: 20px;
}

div {
  background-color: whitesmoke;
}

h1 {
  color: black;
}

h2 {
  font-family: Helvetica;
}

.inner-div {
  font-family: monospace;
  border: .2px solid;
  background-color: lightblue;
  padding: 20px;
  margin-top: 10px;
  max-width: 320px;
  font-size: large;
}

.key {
  max-width: 200px;
  padding: 0px 5px 5px;
}

.key p {
  padding: 4px;
  margin: 0px;
}

.good {
  background-color: lightgreen;
}

.moderate {
  background-color: yellow;
}

.unhealthy-sensitive {
  background-color: orange;
}

.unhealthy {
  background-color: red;
}

.very-unhealthy {
  background-color: violet;
}

.hazardous {
  color: white;
  background-color: purple;
}

#main {
  max-width:600px;
  padding:10px 30px 10px;
}
Feel free to adjust any of the colors, margins, fonts, and other specifications in
You can find all the code in the GitHub repo for this tutorial.
In a command prompt terminal, navigate to your
npm start
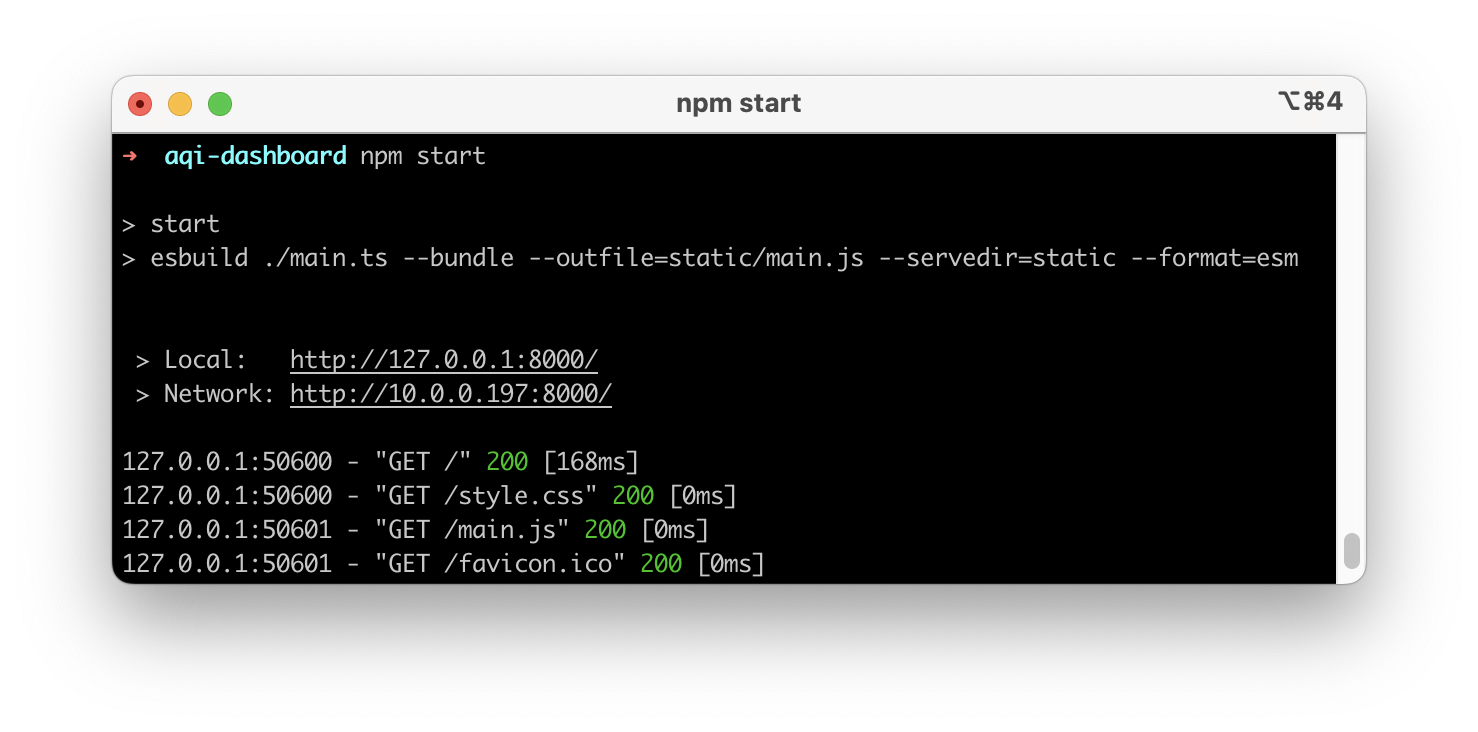
The terminal should output a line such as Local: http://127.0.0.1:8000/.
Copy the URL the terminal displays and paste it into the address bar in your web browser.
The data may take up to approximately 5 seconds to load, then you should see air quality data from all of your sensors.
If the dashboard does not appear, right-click the page, select Inspect, and check for errors in the console.
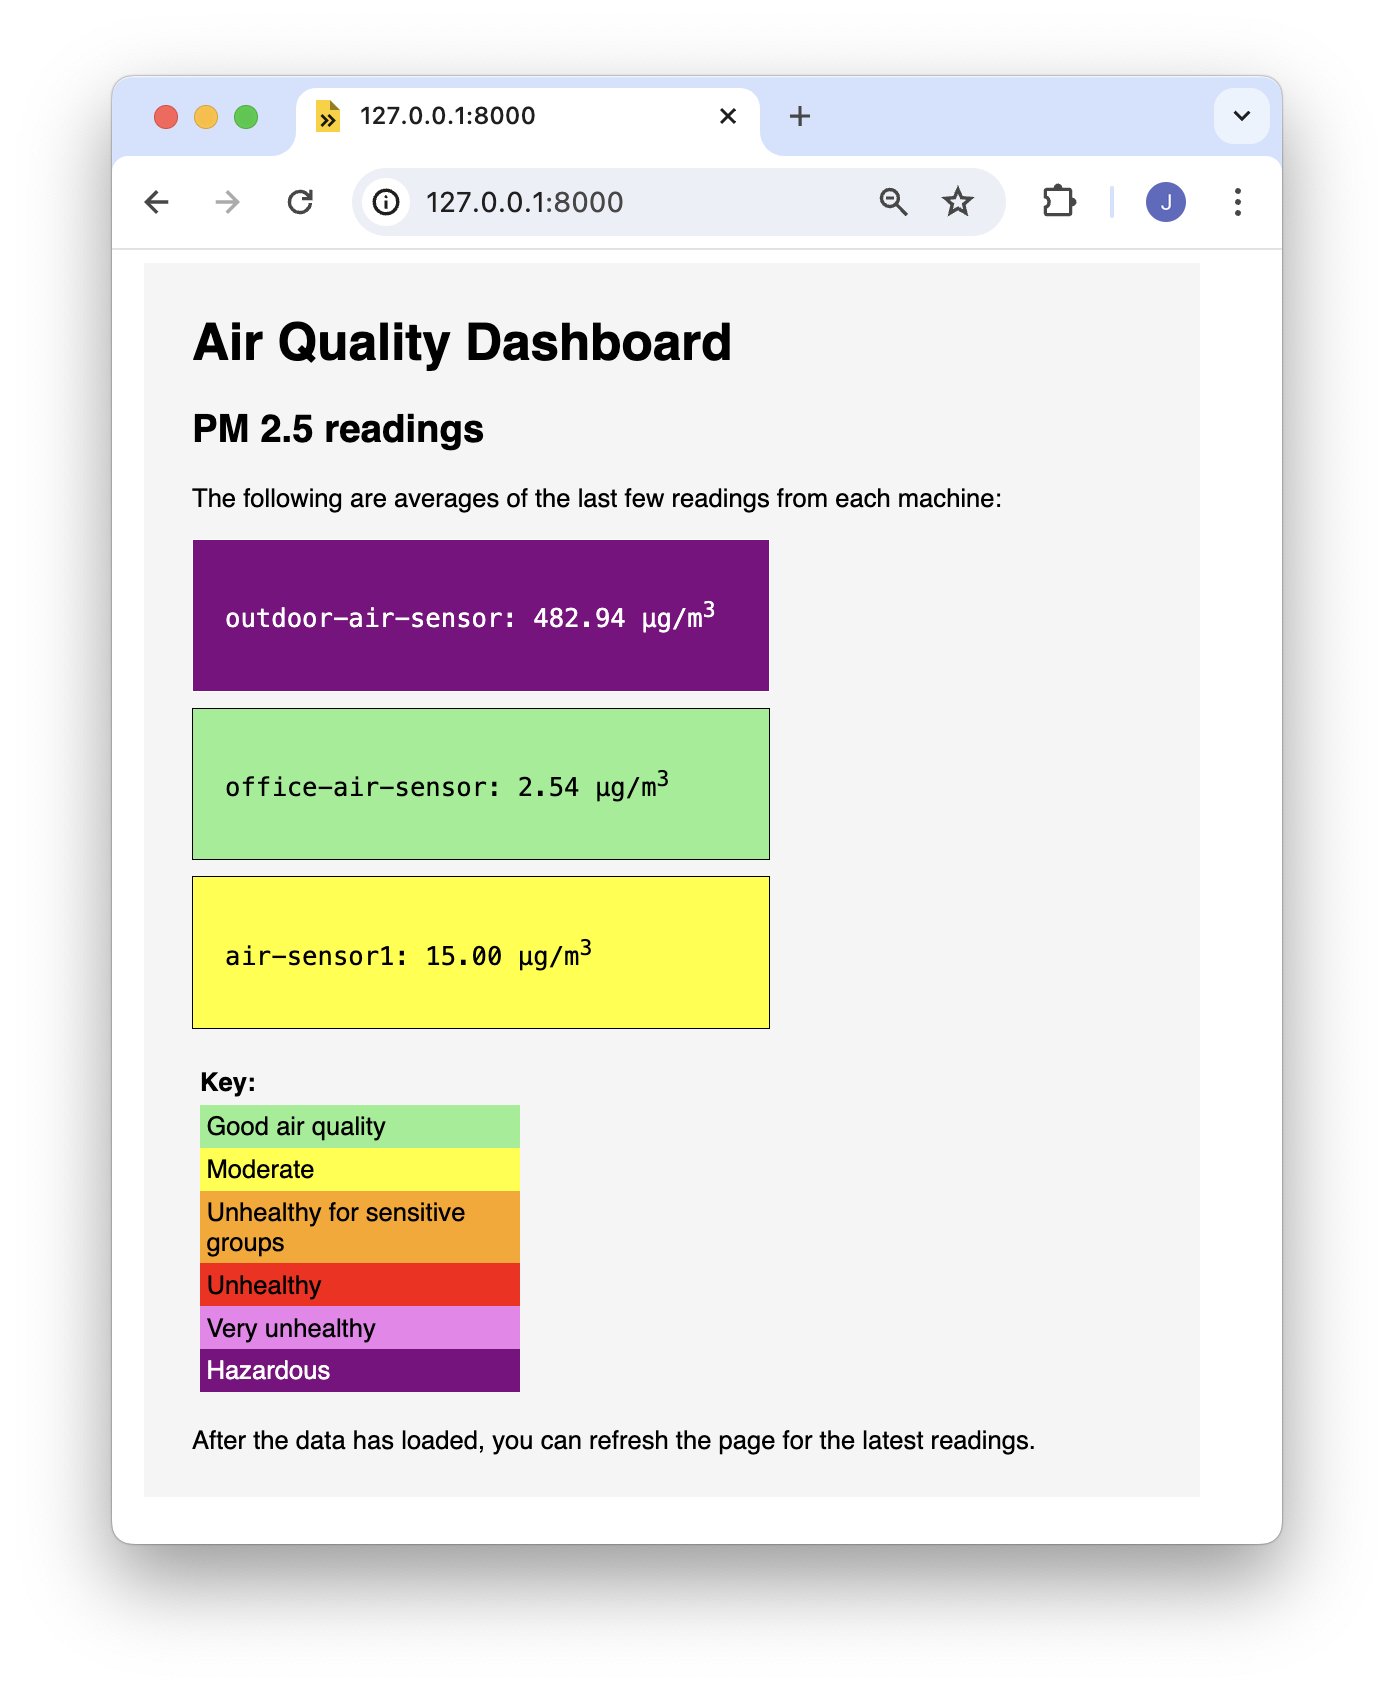
Great work. You’ve learned how to configure a fleet of machines, sync their data to one place, and pull that data into a custom dashboard using TypeScript.
Now that you can monitor your air quality, you can try to improve it and see if your efforts are effective. You might try putting an air filter in your home or office and comparing the air quality data before you start running the filter with air quality after you have run the filter for a while. Or, try sealing gaps around doors, and check whether your seal is working by looking at your dashboard.
You could set up a text or email alert when your air quality passes a certain threshold. For instructions on setting up an email alert, see the Monitor Helmet Usage tutorial as an example. For an example of setting up text alerts, see the Detect a Person and Send a Photo tutorial.
For another example of a custom TypeScript interface, check out the Claw Game tutorial. Instead of displaying data, the claw game interface has buttons to control a robotic arm.
In this tutorial we covered configuring a fleet of machines using fragments, but to automate the setup process further, you can use the Viam Agent to provision machines.
Was this page helpful?
Glad to hear it! If you have any other feedback please let us know:
We're sorry about that. To help us improve, please tell us what we can do better:
Thank you!